circosの使い方
インストール
circos
実行プログラムを上記のwebsiteからダウンロードして,インストールして下さい。
ただ,使い方などよく読まないとまったく理解できません。
一応,パワーポイントで説明していたり,トライアルデータが用意されています。
circos トライアル
私は,直観と感覚で理解する人なので,説明を一切読まず,トライアルをちょこちょこ編集ながら,どういう意味なのか理解していきました。
今回は,一つの例を挙げて説明していきます。
ゴールは,以下のようなのをイメージしています。
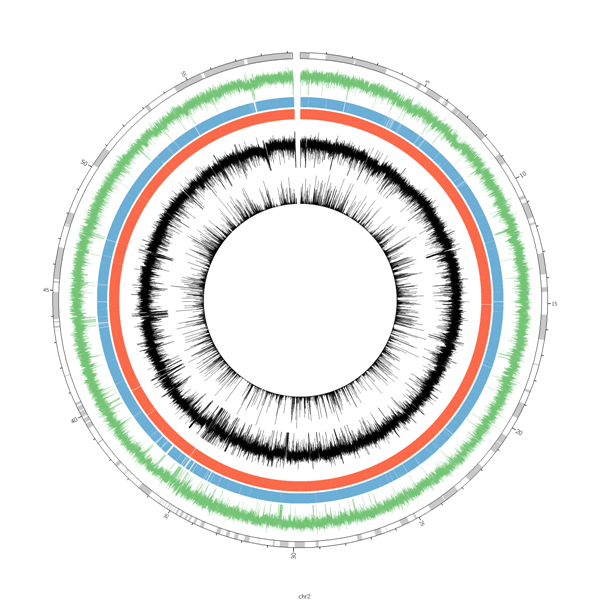
外側から
1. contig長
2. GC content
3. 遺伝子領域
4. 非遺伝子領域
5. DNA-seqのcoverage
6. RNA-seqのcoverage
を1つの図に示したい。
しかしながら,多くのファイルに紐付けされるので,
ちょっと複雑になります。まずは,大本の実行ファイルcircos.confを編集していきます。
---------------------circos.conf----------------------------
show_scatter = yes
show_line = yes
show_histogram = yes
show_heatmap = yes
show_tile = yes
show_highlight = yes
use_rules = yes
<<include colors_fonts_patterns.conf>>
<<include ideogram.conf>>
<<include ticks.conf>>
<image>
<<include etc/image.conf>>
</image>
karyotype = data/length.txt #contig長の情報ファイルを指定する(形式は下記参照)
chromosomes_units = 1000000
chromosomes_display_default = no
chromosomes = sp
<plots>
show = no
######### GC content ###########
<plot>
show = conf(show_line)
type = line
file = data/gc_content.txt #GC%の情報ファイルを指定する(形式は下記参照)
orientation = out
thickness = 1
color = green
r0 = 0.850r
r1 = 0.975r
z = 15
</plot>
######## genetic regions #############
<plot>
show = conf(show_heatmap)
type = heatmap
color = blue
file = data/gene.txt #遺伝子領域の情報ファイルを指定する(形式は下記参照)
stroke_thickness = 0
scale_log_base = 0.25
r0 = 0.80r
r1 = 0.80r+50p
</plot>
######### TE regions ###########
<plot>
show = conf(show_heatmap)
type = heatmap
color = red
file = data/nonexon.txt #非遺伝子領域の情報ファイルを指定する(形式は下記参照)
stroke_thickness = 0
scale_log_base = 0.25
r0 = 0.75r
r1 = 0.75r+50p
</plot>
######### genome coverage ###########
<plot>
show = conf(show_line)
type = line
file = data/bowtie.txt #coverageの情報ファイルを指定する(形式は下記参照)
orientation = out
thickness = 1
color = black
r0 = 0.55r
r1 = 0.70r
max = 50000
z = 15
</plot>
######### mapped region (RNA) ###########
<plot>
show = conf(show_line)
type = line
file = data/tophat.txt #mappingの情報ファイルを指定する(形式は下記参照)
orientation = out
thickness = 1
color = black
r0 = 0.40r
r1 = 0.55r
z = 15
</plot>
</plots>
<<include etc/housekeeping.conf>>
data_out_of_range* = trim
---------------------circos.conf------------------------
色の指定もできる。もっとわかりやすい指定の方法があったような気がする。
---------------------length.txt---------------------
chr - genome 2 1 59195964 genome
band genome chr1 chr1 1 17826 gneg
band genome chr2 chr2 17826 376910 gpos25
band genome chr3 chr3 376910 984358 gneg
.
.
.
---------------------length.txt---------------------
使用したスクリプトこちら
---------------------gc_content.txt---------------------
genome 1 500 38.6
genome 501 1000 41
genome 1001 1500 38.8
.
.
.
---------------------gc_content.txt---------------------
---------------------gene.txt---------------------
genome 12286 12647 1
genome 17934 18826 1
.
.
.
---------------------gene.txt---------------------
nonexon.txtも同じ様に領域を指定する。
使用したスクリプトはこちら
---------------------bowtie.txt---------------------
genome 1 500 234
genome 501 1000 1337
.
.
.
---------------------bowtie.txt---------------------
tohhat.txtも同じ様に領域を指定する。
circos.conを実行してすると,以下のような図が得られる。
実行プログラムを上記のwebsiteからダウンロードして,インストールして下さい。
ただ,使い方などよく読まないとまったく理解できません。
一応,パワーポイントで説明していたり,トライアルデータが用意されています。
circos トライアル
私は,直観と感覚で理解する人なので,説明を一切読まず,トライアルをちょこちょこ編集ながら,どういう意味なのか理解していきました。
使い方
今回は,一つの例を挙げて説明していきます。
ゴールは,以下のようなのをイメージしています。
外側から
1. contig長
2. GC content
3. 遺伝子領域
4. 非遺伝子領域
5. DNA-seqのcoverage
6. RNA-seqのcoverage
を1つの図に示したい。
しかしながら,多くのファイルに紐付けされるので,
ちょっと複雑になります。まずは,大本の実行ファイルcircos.confを編集していきます。
---------------------circos.conf----------------------------
show_scatter = yes
show_line = yes
show_histogram = yes
show_heatmap = yes
show_tile = yes
show_highlight = yes
use_rules = yes
<<include colors_fonts_patterns.conf>>
<<include ideogram.conf>>
<<include ticks.conf>>
<image>
<<include etc/image.conf>>
</image>
karyotype = data/length.txt #contig長の情報ファイルを指定する(形式は下記参照)
chromosomes_units = 1000000
chromosomes_display_default = no
chromosomes = sp
<plots>
show = no
######### GC content ###########
<plot>
show = conf(show_line)
type = line
file = data/gc_content.txt #GC%の情報ファイルを指定する(形式は下記参照)
orientation = out
thickness = 1
color = green
r0 = 0.850r
r1 = 0.975r
z = 15
</plot>
######## genetic regions #############
<plot>
show = conf(show_heatmap)
type = heatmap
color = blue
file = data/gene.txt #遺伝子領域の情報ファイルを指定する(形式は下記参照)
stroke_thickness = 0
scale_log_base = 0.25
r0 = 0.80r
r1 = 0.80r+50p
</plot>
######### TE regions ###########
<plot>
show = conf(show_heatmap)
type = heatmap
color = red
file = data/nonexon.txt #非遺伝子領域の情報ファイルを指定する(形式は下記参照)
stroke_thickness = 0
scale_log_base = 0.25
r0 = 0.75r
r1 = 0.75r+50p
</plot>
######### genome coverage ###########
<plot>
show = conf(show_line)
type = line
file = data/bowtie.txt #coverageの情報ファイルを指定する(形式は下記参照)
orientation = out
thickness = 1
color = black
r0 = 0.55r
r1 = 0.70r
max = 50000
z = 15
</plot>
######### mapped region (RNA) ###########
<plot>
show = conf(show_line)
type = line
file = data/tophat.txt #mappingの情報ファイルを指定する(形式は下記参照)
orientation = out
thickness = 1
color = black
r0 = 0.40r
r1 = 0.55r
z = 15
</plot>
</plots>
<<include etc/housekeeping.conf>>
data_out_of_range* = trim
---------------------circos.conf------------------------
contig長の情報
色の指定もできる。もっとわかりやすい指定の方法があったような気がする。
---------------------length.txt---------------------
chr - genome 2 1 59195964 genome
band genome chr1 chr1 1 17826 gneg
band genome chr2 chr2 17826 376910 gpos25
band genome chr3 chr3 376910 984358 gneg
.
.
.
---------------------length.txt---------------------
GC%の情報
今回は500 bpごとのGC%を算出している。使用したスクリプトこちら
---------------------gc_content.txt---------------------
genome 1 500 38.6
genome 501 1000 41
genome 1001 1500 38.8
.
.
.
---------------------gc_content.txt---------------------
遺伝子領域と非遺伝子領域
---------------------gene.txt---------------------
genome 12286 12647 1
genome 17934 18826 1
.
.
.
---------------------gene.txt---------------------
nonexon.txtも同じ様に領域を指定する。
coverage情報
今回は500 bp毎にマップされたreadをカウントした。使用したスクリプトはこちら
---------------------bowtie.txt---------------------
genome 1 500 234
genome 501 1000 1337
.
.
.
---------------------bowtie.txt---------------------
tohhat.txtも同じ様に領域を指定する。
完成図
circos.conを実行してすると,以下のような図が得られる。